01
Before entry
Check whether your proposed trade is heading directly into nearby resistance, support, a Fib cluster, VWAP, POC, pivot, OB/FVG or another reaction area.
Often it is not your order. It is a resistance, support or confluence level you simply did not see. GP Confluence Scanner is built to show what is sitting in front of price before you commit risk — and the levels it generates can confirm the trade ideas you already have.

Traders often enter, see price move a little in their favour, then watch it reverse from a level that was already there. The scanner is designed to make that check fast.
Check whether your proposed trade is heading directly into nearby resistance, support, a Fib cluster, VWAP, POC, pivot, OB/FVG or another reaction area.
See the roadblocks sitting between current price and your target, so you are not surprised by an obvious level only after price reaches it.
Use scanner zones as an additional layer beside your own strategy. It does not need to replace the way you already trade.
Switch individual families on and off and see where multiple methods agree around the same price area.
Each family stays identifiable, so you can see why a level exists and decide whether it supports or conflicts with your own trade idea.
The scanner is built as a working chart toolkit rather than a single mystery signal.
Key difference: GP Scan and AW Scan use the same overall confluence workflow; the main difference is swing depth. GP Scan is the shallower/local view, while AW Scan searches deeper through confirmed swing history.
Uses the nearer / shallower confirmed swing depth to find Golden Pocket and Fib-led confluence zones across the configured timeframes.
Uses a deeper confirmed swing depth, reaching further back through swing history to expose broader Fib relationships that GP Scan may not include.
Structure-led workflow using active market structure and additional confluence filters.
Draw the Fib range you want, then build POC, VAH and VAL from that same selected range.
Map actual swing geometry with multiple channel rails and keep more than one channel on the chart.
Use measured extensions, Fib Time and ABC / COP / OP / XOP tools without leaving the scanner workflow.
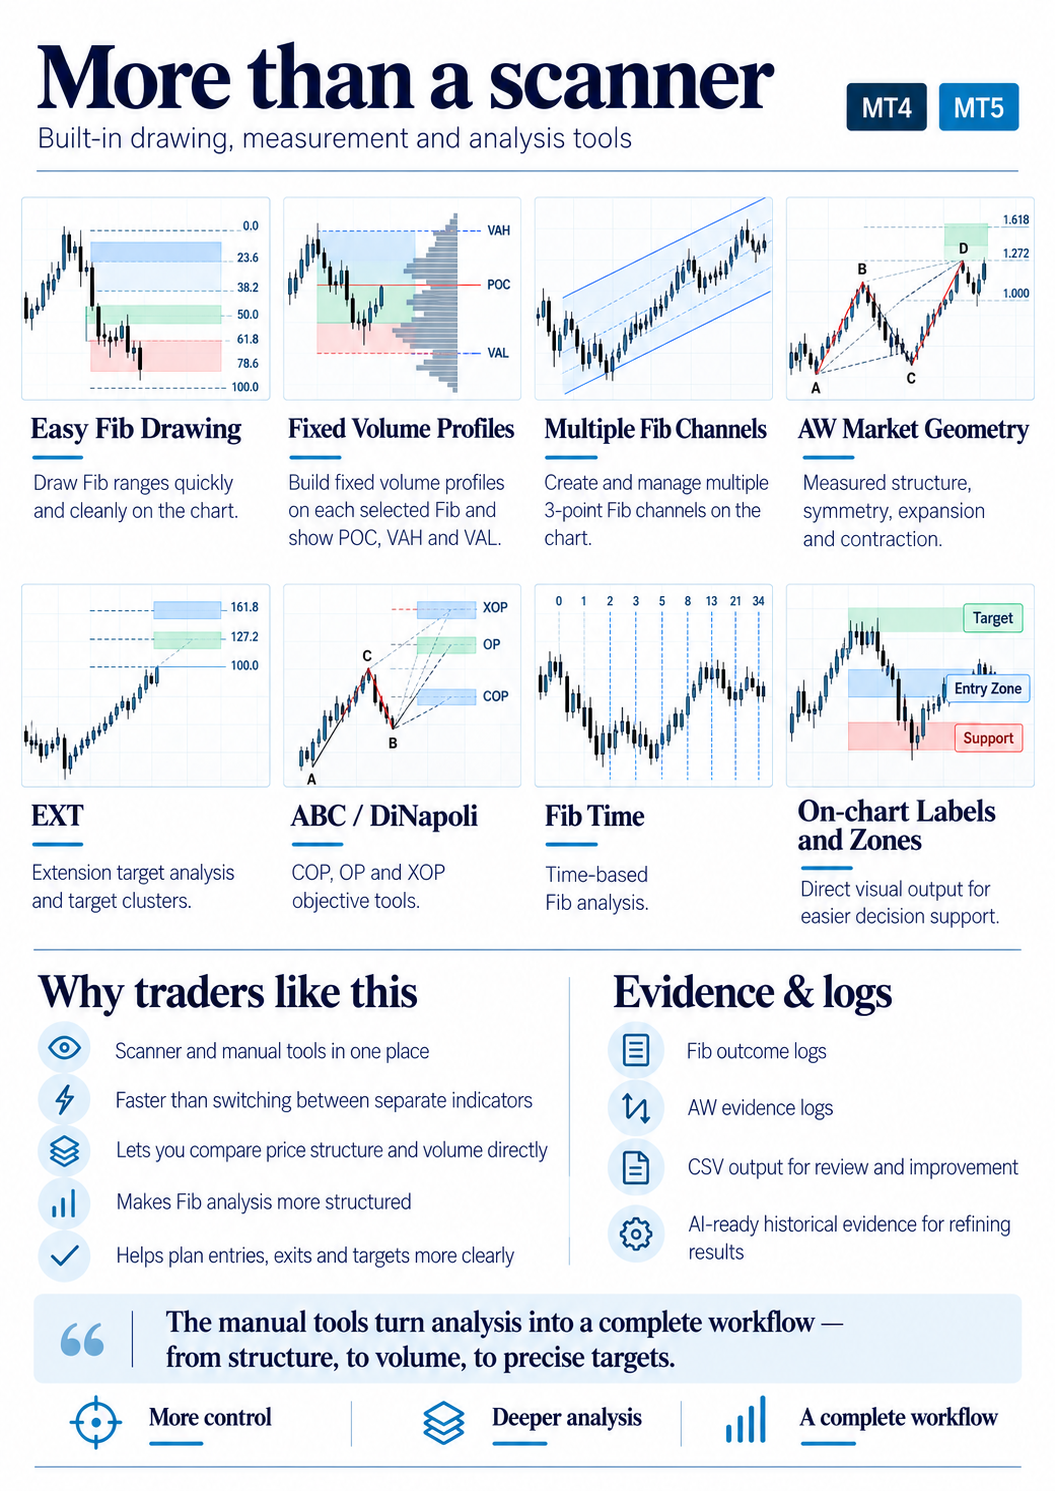
FIB GEO is a separate current-timeframe geometry engine. It chooses the structure from confirmed swings and market force first, then uses Fibonacci as validation afterwards — so the anchors are not moved simply to manufacture a Fib fit.
It builds three nested ranges — d, e and f — and compares their 50% centres. The result is described as SYMMETRICAL, EXPANDING UP/DOWN, CONTRACTING UP/DOWN or MIXED / TRANSITION.
After the geometry is selected, the d range is checked against 38.2 / 50 / 61.8 milestones to provide a WEAK / GOOD / STRONG validation description. Optional VOID / EXH guidance adds context relative to the next meaningful opposing grid zone.
The tool is intended to support decision-making, not tell you that every highlighted level will reverse price.
Both licence options include GP Confluence Scanner for MT4 and MT5. Registration and payment are handled inside the indicator.
Full access to GP Confluence Scanner for MT4 and MT5 on a monthly licence.
One payment for a permanent GP Confluence Scanner licence for MT4 and MT5.
Download the compiled MT4 indicator, attach it to a chart and start the 7-day trial. Use the on-chart registration/licence panel when prompted.
Download MT4 - 7-day trialDownload the compiled MT5 indicator, attach it to a chart and start the 7-day trial. Use the on-chart registration/licence panel when prompted.
Download MT5 - 7-day trialNo. It is a chart-analysis and decision-support tool. It identifies and displays confluence, structure and market-reference levels so you can make your own trading decisions.
Yes. One of its main uses is as a confirmation layer. You can keep your own entry model and use the scanner to check what is sitting around or in front of the trade.
The trial starts when the indicator is first opened. The website does not take payment; registration, licence selection and payment are handled inside GP Confluence Scanner.
FIB GEO is the current-timeframe market-geometry engine. It builds nested d/e/f ranges from confirmed structure, compares their 50% centres for symmetry/expansion/contraction, then validates the selected geometry with Fibonacci milestones.
Yes. Separate MT4 and MT5 builds are provided.
No. Registration and licence purchase options are handled from inside the GP Confluence Scanner itself.
No. No chart tool can guarantee future market behaviour. GP Confluence Scanner is designed to make relevant market information easier to see before and during a trade.
Trading leveraged products such as Forex, indices and CFDs involves significant risk and may not be suitable for everyone. GP Confluence Scanner is analytical software only. Nothing on this website is personalised investment advice, a trading signal service or a guarantee of future performance.